
Microservice architectures running on containers have made applications easier to scale and faster to develop. As a result, enterprises are able to innovate faster and accelerate time-to-market for new features. To make management of microservices even more efficient and easier to run, service mesh solutions like Istio, Envoy, and Linkerd – and now AWS App Mesh – have become the next core building blocks of microservices infrastructure built on containers.
Today Sysdig announced support for AWS App Mesh as Amazon moves their solution from public preview to general availability (GA). Our goal is to simplify visibility and security for AWS App Mesh in addition to the containers and microservices AWS App Mesh supports. Read on for more details, including how Sysdig takes advantage of the Envoy proxy’s Prometheus endpoint to auto-collect metrics.
What is a service mesh?
A service mesh is a software infrastructure layer for controlling and monitoring internal, service-to-service traffic in microservices applications. It typically takes the form of a “data plane” of network proxies deployed alongside application code, and a “control plane” for interacting with these proxies. For containers, service meshes ensure that interprocess communication is fast, reliable, and secure. In addition, a service mesh helps to run, manage, and monitor containerized microservices more efficiently at scale. In particular, to accomplish this goal, service mesh solutions typically provide capabilities like service discovery, authentication, load balancing, encryption, and tracing.
What is AWS App Mesh?
AWS App Mesh is a managed service mesh platform for ECS, EKS and Fargate.
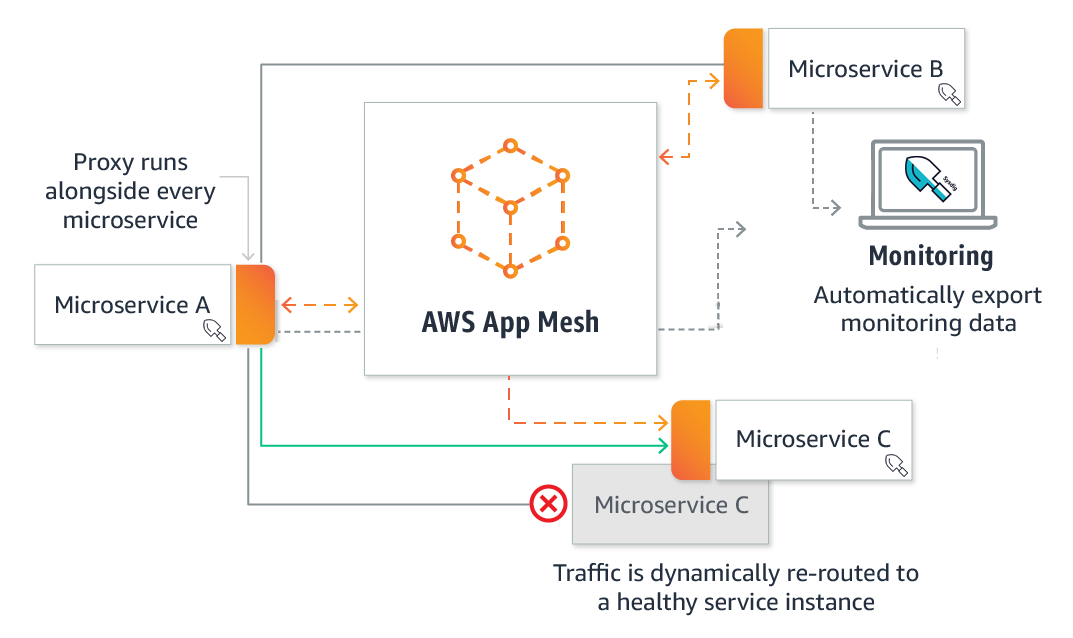
AWS App Mesh easily monitors and controls communications across microservices applications running on AWS services. By utilizing the open source Envoy proxy in a sidecar pattern, the AWS App Mesh removes the need to update application code to change how monitoring data is collected or traffic is routed between microservices.
App Mesh configures each microservice to export monitoring data. It also implements consistent communications control logic across your application. As a result, this makes it easy to quickly pinpoint the exact location of errors and automatically reroute network traffic when there are failures or when code changes need to be deployed.
Monitoring your AWS App Mesh with Sysdig
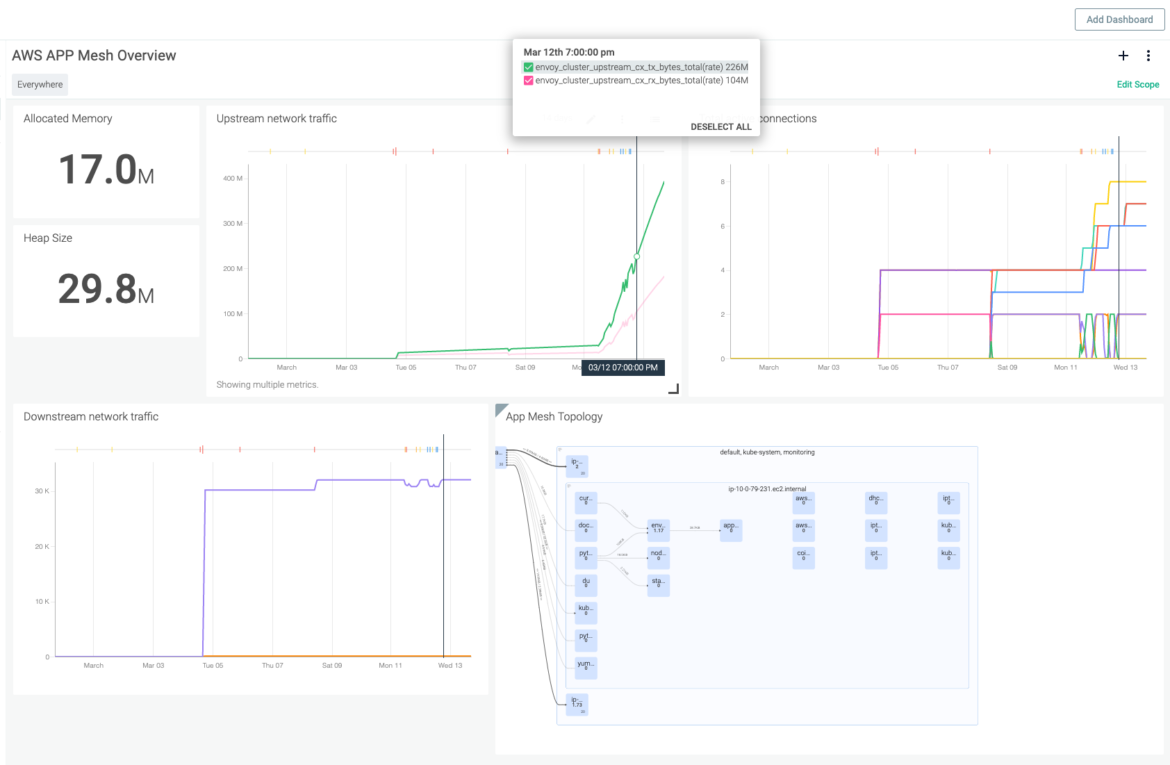
Sysdig simplifies App Mesh monitoring with the ability to automatically scrape metrics from the Envoy proxy’s Prometheus endpoint. ContainerVision, Sysdig’s patented data collection technology, enables you to securely collect, alert on and visualize the Prometheus metrics from Envoy. For example, the types of metrics collected include:
- Envoyclusterupstreamcxactive: Total number of active connections
- Envoyclusterupstreamrqtotal: Total number of requests
- envoyclusterupstreamcx[rx/tx]bytestotal: Upstream Network Traffic
- And many more
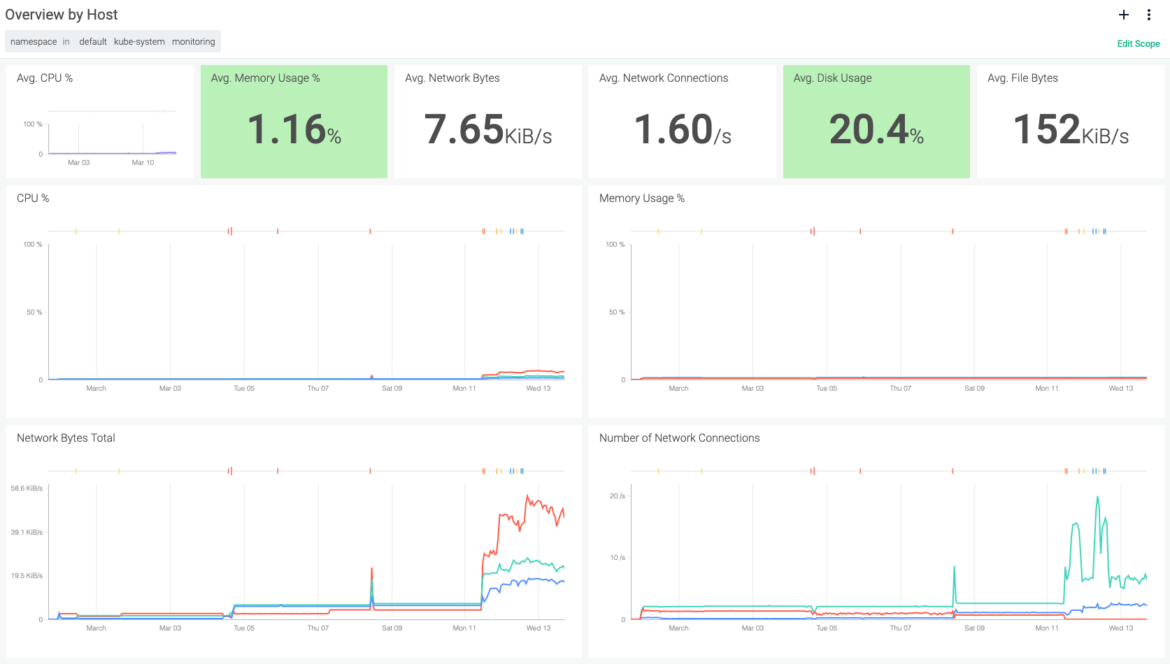
Once collected, the Sysdig platform enables you to correlate AWS App Mesh data with the vast amount of metrics and events data that the Sysdig agent collects. This includes metrics and events from across the entire container infrastructure. In fact, this applies whether it is Amazon Elastic Container Service (ECS) or Elastic Container Service for Kubernetes (EKS). Sysdig then enables viewing metrics in a service context using ServiceVision. Specifically, Sysdig’s ServiceVision technology communicates with AWS and Kubernetes to auto-tag and enrich metrics with orchestration metadata.
Getting started with AWS App Mesh with EKS
Here are the steps to get started using AWS App Mesh with EKS:
STEP 0:
Clone the repo referenced here: https://github.com/awslabs/aws-app-mesh-examples
STEP 1:
Setup the aws-cli. You can find directions here: https://docs.aws.amazon.com/cli/latest/userguide/cli-chap-install.html
Once the CLI is set up, next create a folder called .aws in your home folder (please check the install instructions for windows systems). The folder should contain two files called config and credentials. If they don’t exist create them.
Contents of config:
[default]
output = json
region = us-east-1
Contents of credentials:
[default]
aws_access_key_id = <aws-access-key-id>
aws_secret_access_key = <aws-secret-access-key>
Note: Get the above lines from your AWS IAM user role.
STEP 2:
Build and push the colorteller and gateway container images using deploy.sh from within /examples/apps/colorapp/src/
In Elastic Container Registry, created two new repositories:
colorteller
gateway
Build the docker images as follows:
$ cd apps/colorapp/src/colorteller/
$ ./deploy.sh
$ cd -
$ cd apps/colorapp/src/gateway
$ ./deploy.sh
$ cd -
This should build and push the example applications to your ECR registry.
Now export the following environment variables:
$ export AWS_PROFILE=<aws-profile for aws-cli>
//it is default from the above config
$ export AWS_REGION=<aws-region for aws-cli>
//us-east-1 from above
$ export AWS_DEFAULT_REGION="$AWS_REGION"

$ export ENVIRONMENT_NAME=<friendlyname-for-stack e.g. AppMeshSample>
$ export MESH_NAME=<your-choice-of-mesh-name, e.g. default>
$ export KEY_PAIR_NAME=<key-pair to access ec2 instances>
$ export ENVOY_IMAGE="111345817488.dkr.ecr.us-west-2.amazonaws.com/aws-appmesh-envoy:v1.8.0.2-beta"
$ export CLUSTER_SIZE=<number of ec2 instances to spin up to join cluster>
$ export SERVICES_DOMAIN=<domain under which services will be discovered, e.g. "default.svc.cluster.local">
$ export COLOR_GATEWAY_IMAGE=<image location for colorapp's gateway, e.g. "<youraccountnumber>.dkr.ecr.<region-name>.amazonaws.com/gateway:latest"
$ export COLOR_TELLER_IMAGE=<image location for colorapp's teller, e.g. "<youraccountnumber>.dkr.ecr.<region-name>.amazonaws.com/colorteller:latest"
STEP 3:
Let’s setup the infrastructure.
Setup VPC:
$ ./infrastructure/vpc.shSetup the service mesh:
$ ./infrastructure/mesh.shSetup EKS Cluster:
$ ./infrastructure/eks-cluster.shSTEP 4:
Once you complete the above steps, next, you need to “associate” the eks cluster with EC2 instances launched for the cluster.
$ aws eks update-kubeconfig --name ${ENVIRONMENT_NAME}The above line updates your .kubeconfig file to point to your newly created EKS cluster.
Next, create a configmap file called aws-auth-cm.yaml and paste the following contents:
apiVersion: v1
kind: ConfigMap
metadata:
  name: aws-auth
  namespace: kube-system
data:
  mapRoles: |
    - rolearn:
      username: system:node:{{EC2PrivateDNSName}}
      groups:
        - system:bootstrappers
        - system:nodes
Note: The NodeInstanceRole ARN is auto generated and you will need to retrieve it from the IAM console. Search for <appmesh environment name>-eks-cluster-NodeInstanceRole-*>
Now apply the config map:
$ kubectl apply -f aws-auth-cm.yamlSTEP 5:
Launch the example colorapp.
Deploy color-teller and color-gateway to EKS:
$ ./kubernetes/generate-templates.sh && kubectl apply -f
./kubernetes/colorapp.yaml
Verify by doing a curl on color-gateway:
$ kubectl run -it curler --image=tutum/curl
--env="SERVICESDOMAIN=${SERVICESDOMAIN}" bash
root@curler-zzzzzz:/# curl -s --connect-timeout 2
http://colorgateway.${SERVICES_DOMAIN}:9080/color
STEP 6:
To change the route weights, use the route_canary.sh script
$ export MESH_NAME=<name of your servicemesh>
$ cd examples/apps/colorapp/servicemesh
$ ./route_canary.sh
Sysdig Monitor and AWS App Mesh
Using Sysdig Monitor, you can automatically scrape any of the AWS App Mesh Prometheus metrics exposed by your containers or pods. To that end, here’s how to get started monitoring AWS App Mesh with Sysdig:
Enable the Prometheus metrics feature in the Sysdig Agent:
Assuming you are deploying using DaemonSets, you can add the needed config to the agent’s configMap (sysdig-agent-config-map.yaml):
prometheus:
 enabled: true
 process_filter:
    - include:
     port: 9901
     conf:
        port: 9901
        path: "/stats/prometheus"
That’s it! Thereafter you’ll quickly see auto-discovered Envoy/Prometheus metrics being displayed in the Sysdig Monitor UI.
Conclusion
To sum up, with AWS App Mesh, AWS users who deploy containers have a way to massively simplify running microservices at scale. Consequently, this is a huge advantage to customers who deploy more and more cloud-native apps on AWS infrastructure. Even more, by pairing Sysdig with your microservices deployments, you gain deep visibility into your service mesh. In addition to metrics from AWS, you’ll also be able to visualize every aspect of your containerized environment including hosts, containers, networks, services, Kubernetes, applications and more. Undoubtedly, this will make monitoring your microservices easier and more efficient.
To get started today with Sysdig and AWS visit our AWS marketplace page or click here to start a free trial.