Our 2018 Docker Usage Report provides an inside look at shifting container trends as revealed by a point-in-time snapshot of real-world container usage as reported by the Sysdig Monitor and Sysdig Secure cloud service.
The quick summary: Organizations are getting more bang for their hardware buck by packing in 50% more containers per host, Docker still rules the roost but brand name container runtime environments are making inroads, and Kubernetes is still the king of container orchestration.
Our second annual Docker usage report show tremendous momentum across the Docker container ecosystem year-over-year. As more organizations transition to DevOps and microservices models, and advance expertise in the “modern stack”, we see more activity and more scale, but also an increased need for understanding all of the pieces that work well together.
Our study sample includes a broad cross-section of vertical industries and companies ranging in size from mid-market to large enterprises across North America, Latin America, EMEA, and Asia Pacific. Data from 90,000 containers – twice the sample size of last year – provides unique insight into use of containers in production.
What follows is a summary of the key findings. For full details, download your own copy of the report here.
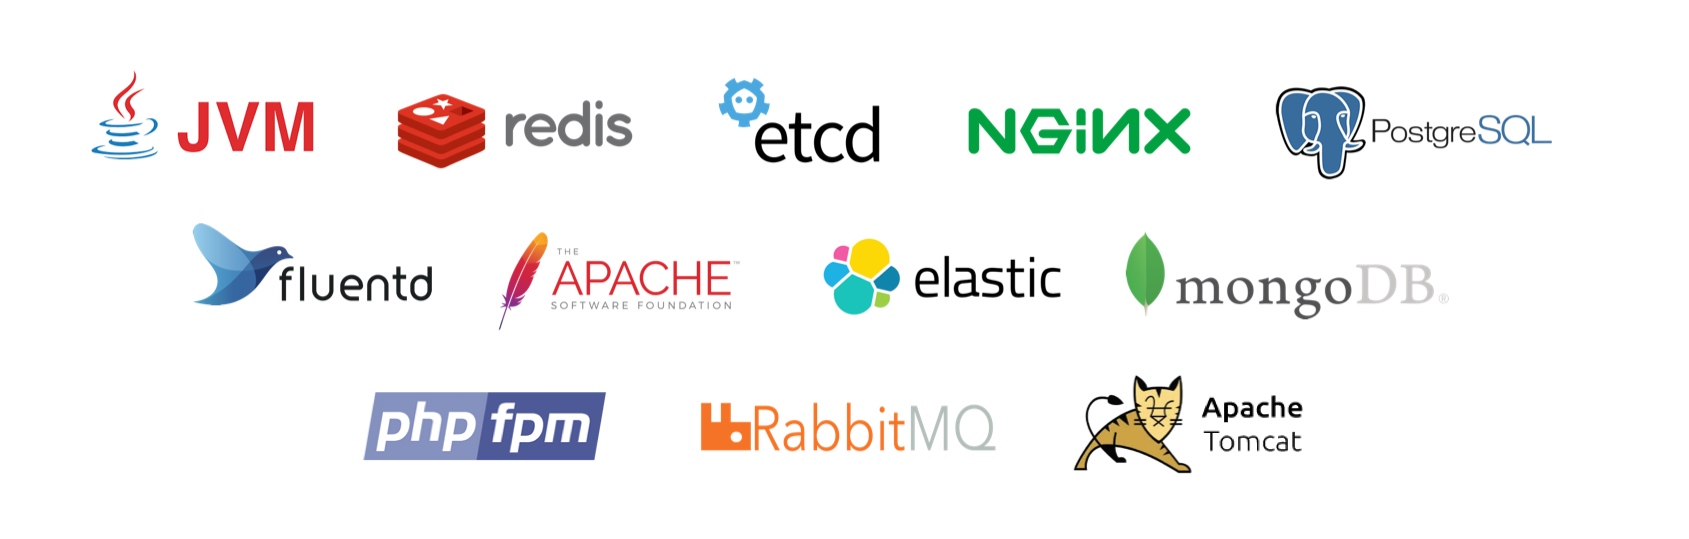
The top 12 application components running in containers
Key Assessment: The old merges with the new
Sysdig’s auto-discovery mechanism –
ContainerVision™ – shows what processes are used inside containers. Users are consistently utilizing open source solutions to construct their microservices and applications.
Java Virtual Machines (JVM) top the list. Java has been relied on for app services in the enterprise before containers arrived, and now the two – Java and containers – come together as organizations adopt a modern day delivery model.
In addition, increased usage of database solutions like PostgreSQL and MongoDB running in containers signal that the move is on to stateful services in containers. The ephemeral nature of containers left many concerned about running services that collect valuable corporate data in containers. The concern appears to be easing as the data suggests customers are beginning to move to environments completely driven by containers.
Container density ratchets up
Key assessment: Median container density per host rises 50% year-over-year.
One of the catalysts for the transition from bare-metal and VM-centric environments to containers is the promise of more efficient utilization of server resources. Compared to
our 2017 report, the median number of containers per host per customer climbed 50%, from 10 to 15.
At the other end of the spectrum, in this survey we saw a customer running
154 containers on a single host! This is up from 95 that we observed last year. That’s a lot of containers.
What container runtimes are in use?
Key assessment: Docker still reigns, but we’re seeing what might be the first signs of cracks in the dam.
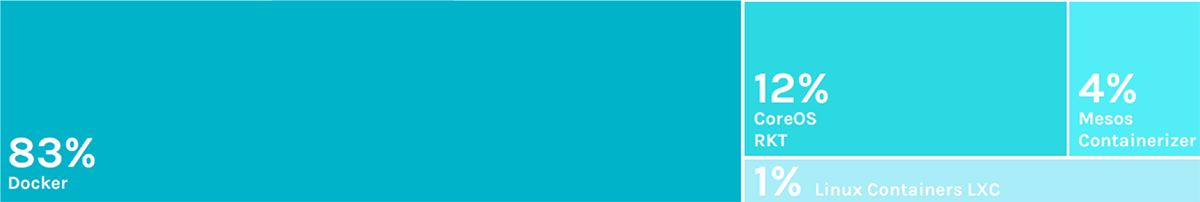
Figure 4. Container runtimes: Docker leads, followed by rkt and Mesos.
shows up the most in production. We didn’t report on other container runtime details in 2017 because, at the time, Docker represented nearly 99% of containers in use. With the recent
acquisition of CoreOS by Red Hat (the maker of rkt), and programs like the
Open Container Initiative (OCI), which seeks to standardize container runtime and image specifications, we wanted to take a fresh look to see if container runtime environments are shifting.
In fact they are. In the last year, customers have increased their use of other platforms. Rkt grew significantly to 12%, and Mesos containerizer to four percent. LXC also grew, although at a significantly lower rate. It appears from the data that customers have a greater comfort level with using “non-Docker” solutions in production.
Lifespan of containers and services
Key assessment: 95% of containers live less than a week
With so much industry discussion about the ability to spin services up and down quickly, we decided to look at the lifespan of containers, container images and container-based services.
Just how long do containers and services live?
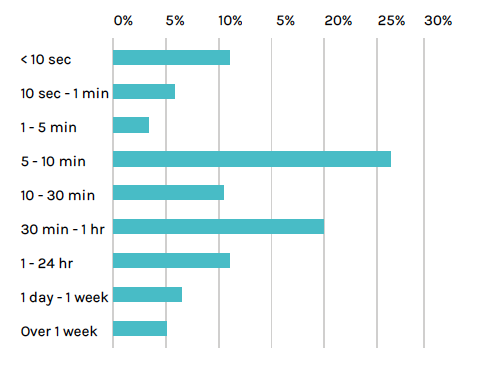
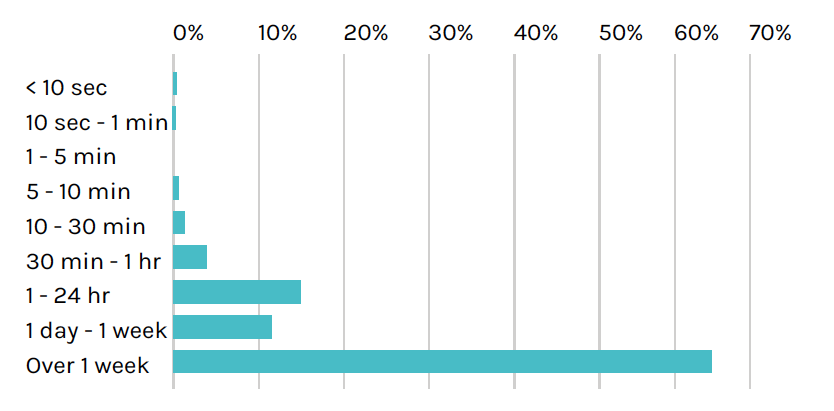
The following chart highlights the percentage of containers that appear and disappear over different intervals up to and beyond one week.
Eleven percent of containers stay alive for less than 10 seconds. The largest percentage – 27% – are containers that churn between five to 10 minutes.
Why do so many containers have such short lifespans? We know many customers have architected systems that scale as needed with demand and live only as long as they add value. Containers are created, do their work, and then go away. As an example, one customer spins up a container for each job they create in Jenkins. They test the change, then shut down the container. For them this takes place thousands of times a day.
We also looked at how long container images were in use. By looking at this data, we get an idea of how often customers are doing new deploys of updated containers as a part of their DevOps CI/CD process.
Taken altogether, 69% of images are updated in the span of a week.
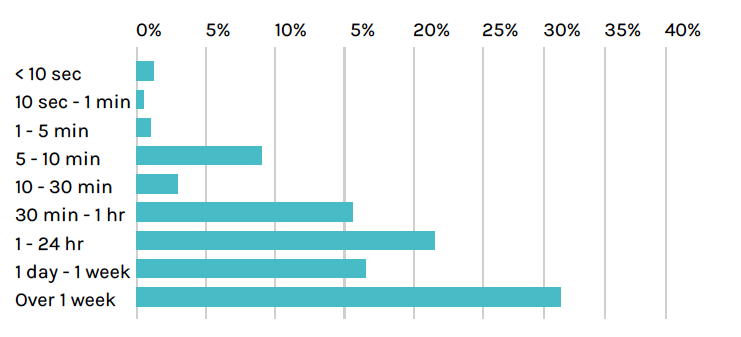
We also asked,
“What is the lifespan of a service?”In Kubernetes, the service abstraction defines a set of Pods that deliver a specific function and how to access them. Services allow pods to die and replicate without impacting the application. For example, a cluster may run a Node.js JavaScript runtime service, a MySQL database service, and an NGINX front end service.
Here we see that a majority of services – 67% – live beyond a week. For most customers the goal is to keep applications working around the clock. Containers and pods may come and go, but it is expected that services are up and available.
Orchestrators for Docker containers
Key assessment: First place goes to Kubernetes, followed by Kubernetes and then Kubernetes.
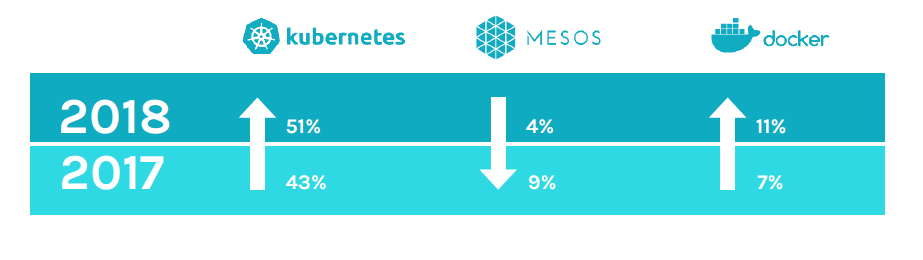
Figure 8. Kubernetes and Swarm grow orchestrator share, Mesos shrinks.
Sysdig
ServiceVision™ automatically identifies orchestrators in use, correlating logical infrastructure objects with container metrics. This awareness tells us what orchestrators are deployed by customers. In the 2018 study
Kubernetes retained the hold on the lead position for the most frequently used orchestrator. No real surprise there as the past year has seen the market evolve and Kubernetes embraced seemingly across the board.
For example, Microsoft uses Kubernetes for its
Azure Kubernetes Service (AKS), as does IBM with its
Cloud Container Service and
Cloud Private offering. Even Docker and Mesosphere have added support and functionality for Kubernetes. This means clear lines of demarcation no longer exist as they did in previous years. For instance, Mesosphere is able to deploy and manage “Kubernetes-as-a-service” in a DC/OS environment. Multiple Kubernetes clusters may be deployed under a single Mesosphere cluster.
For our report, we didn’t identify where customers use both orchestrators, but we plan to delve into that in the future.
Docker Swarm climbed into the second slot in this year’s study, surpassing Mesos-based tools. Given Docker has embraced Kubernetes, we didn’t expect this. Possible drivers include:
- Swarm’s barrier to entry is incredibly low. While it may not have all the features of Kubernetes, as more people start with containers this may be the first stop in orchestration.
- Docker Enterprise Edition, featuring the Docker Universal Control Plane (UCP) graphical user interface, simplifies many operational aspects of getting started with Swarm. Since Docker’s Kubernetes tie-in came late in 2017, any change in adoption in our customer base from Swarm to Kubernetes might be still forthcoming.
Figure 8. Kubernetes and Swarm grow orchestrator share, Mesos shrinks.
Cluster size influences orchestrator choice
Key assessment: Mesos owns the big cluster game.
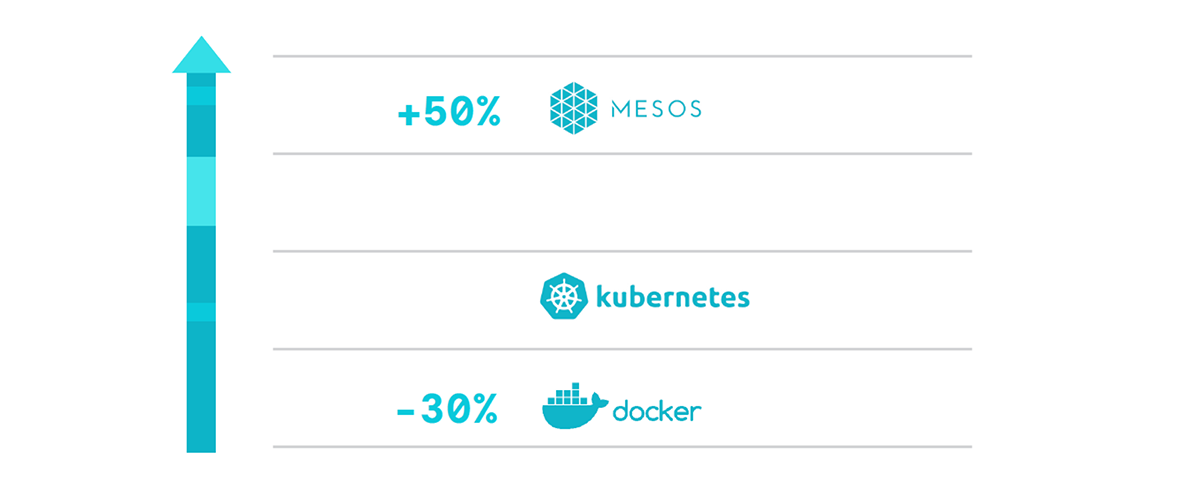
Figure 9. Mesos clusters 50% larger than Kubernetes. Swarm 30% smaller.
Besides looking at the number of customers using each orchestrator, we asked, “Does cluster size influence which orchestrator an organization might choose?”
While Mesos-based orchestration, including
Mesos Marathon and
Mesosphere DC/OS, dropped to third in this study, where Mesos is used, the median number of containers deployed is 50% higher than Kubernetes environments. This makes sense given Mesos tends to be targeted at large-scale container and cloud deployments. So while fewer in number, Mesos clusters are typically enterprise-scale.
Swarm clusters, conversely, were 30% smaller compared to Kubernetes.
Top flavors of Kubernetes
Key assessment: Here come the Kubernetes distributions.
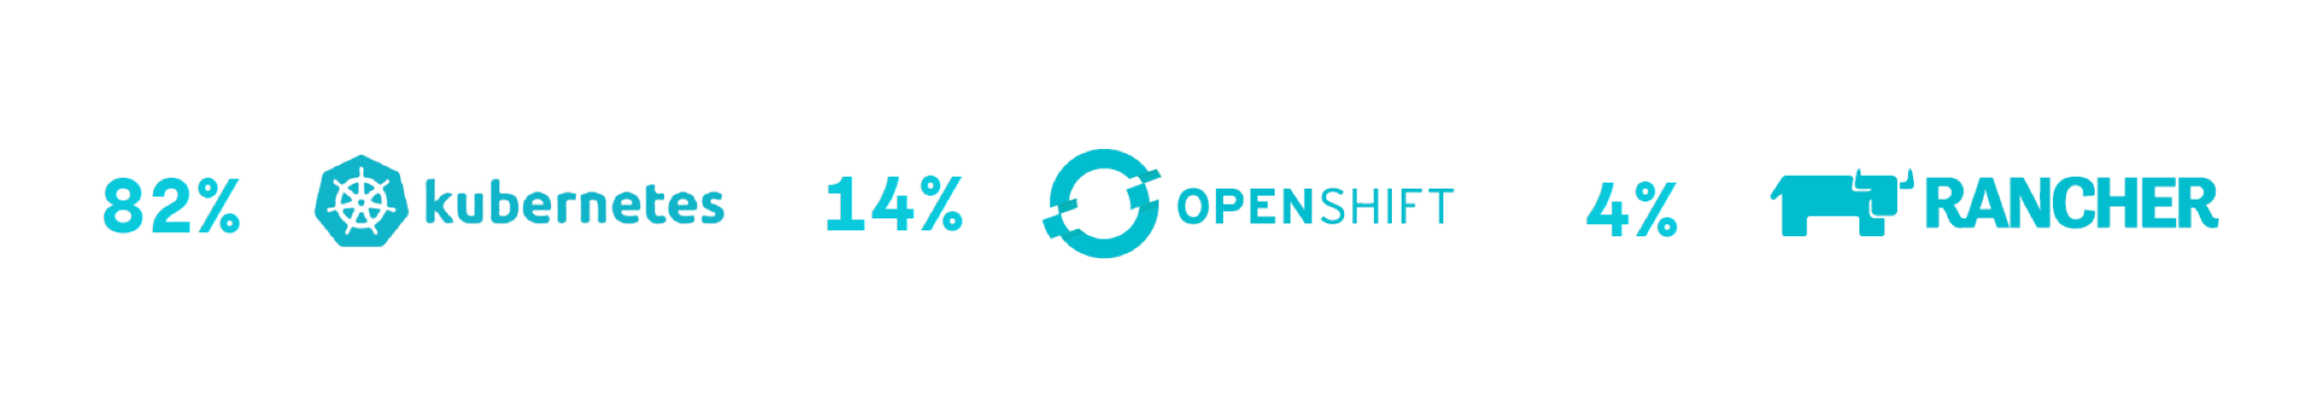
Figure 10. Open source Kubernetes most used, followed by OpenShift and Rancher distributions.
This year, we dissected the use of Kubernetes by “brand,” looking to see if the flavor of Kubernetes in-use was the upstream open source version, or a package provided by a specific vendor. We found that open source Kubernetes continues to hold the lion-share, but it appears that
OpenShift is making inroads and
Rancher has made some gains as well.
Anecdotally, at Sysdig we see a greater percentage of our on-prem customers, who tend to be larger enterprises running Sysdig solutions in private data centers, adopt OpenShift in greater numbers than customers of our SaaS offering.
Rancher Labs emerged in 2015 with support for both Docker Swarm and Kubernetes. It wasn’t until 2017 that Rancher fully embraced Kubernetes as its orchestrator of choice.
Most popular alert conditions when using Docker containers
Key assessment: It’s all about performance and uptime
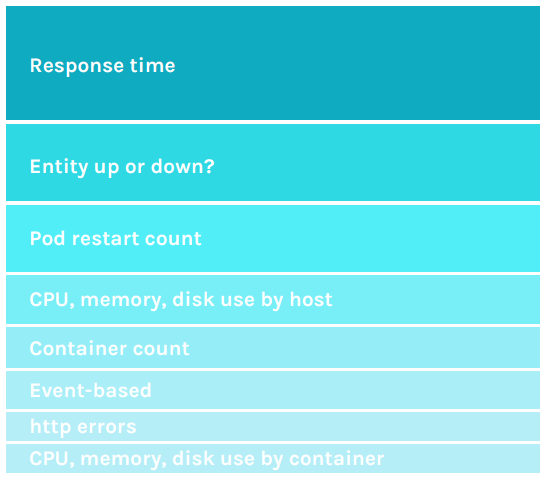
Figure 11. Top alerts focus on response time and uptime of application services.
What keeps container administrators up at night? One way to see is to examine the types of alerts they configure in their container environments.
Responsiveness of app services is at the top of the list. Users want to know, “Is my app performing badly?” To see if a service is running well – or not – users look for the four “
Golden Signals” – latency, traffic, errors, and saturation. Sysdig provides Golden Signal dashboards featuring these metrics to help answer the questions:
- How long does it take to service a request?
- How much demand is being placed on the system?
- How often do requests fail?
- How constrained are system resources?
With this knowledge, users have a good idea of whether the user experience is good or degraded.
Response time is the most widely used alert type configured, closely followed by uptime/downtime alerts. Sysdig allows thresholds so temporary blips, that are well-managed by a well-orchestrated environment, don’t result in false alarms.
Tried and true resource metrics – cpu, memory, and disk usage – are still widely used, with host-based alerts being the most frequently set. Users want to know if the server hosting Docker (physical, VM or cloud instance) is under strain or reaching capacity. The trigger for these alerts is most often set between 80-95% utilization.
On the rise, however, are container-focused resource alerts. The top used alerts come mainly in two flavors, 1) resource utilization, and 2) container count.
By default, containers have no resource limits. Given customers are increasingly alerting on container limits implies they are using Docker runtime configurations to control how much memory, CPU, or disk I/O containers can use and want to know when that goes out of scope and puts application performance at risk.
For container count, the concern is typically tied to the fact that users want at least X number of containers of a given type up and functioning to deliver the required service levels, especially in microservices deployments. For example, “I know my app works well when at least three NGINX containers are up. Anything less and I want to know.”
Orchestration-focused alerts are also increasingly popular. “Pod Restart Count” tops the list. In a pod, one or more containers are co-located and co-scheduled, typically as a part of a microservice. If a pod restarts too frequently, it indicates a problem that is likely to impact application performance.
Kubernetes administrators often use event-based alerts as well. This differs from metric-based alerts in that Sysdig looks for event messages generated in the environment such as a Kubernetes “
CrashLoopBackoff” condition, where pods fail and restart repeatedly, or “Liveness probe failed,” which indicates whether a container is alive and running.
Http errors rounds out the list of top alert conditions. Http errors can indicate a problem with software or infrastructure that will ultimately impact performance.
Popular alert scopes
Key assessment: Users want to know – How’re my pods doing?
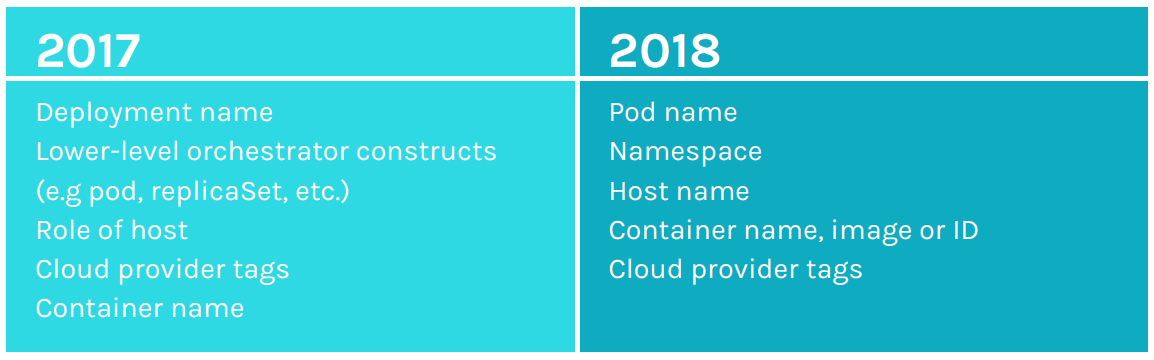
Figure 12. Kubernetes pod and namespace rises to top of alert scoping in 2018.
Alerts are not a one-size-fits-all approach. Alerts can be set or “scoped” for a subset of the environment – be it logical or physical entities – or for the entire infrastructure. Scoping targets any tag or label collected and displayed in the Sysdig solution.
In the 2018 study the most common tags used to scope an
alert are tied to Kubernetes. Scoping by pods is the leading choice followed closely by namespace. That’s not to say that physical hosts don’t matter. Our customers say they do. This is revealed by the fact that scoping by host names and tags is a solid third when it comes to choosing an alert scope.
Container specific scoping is also popular, evenly split across container name, container image, and container ID. Cloud provider tags in 2018 again rank high on the list, frequently targeting “name,” “environment,” “ID,” and “region” tags to scope by resource, dev/test and production, application, and location of cloud data center.
Custom metrics for application and infrastructure monitoring
Key assessment: There’s no one custom metrics format to rule them all
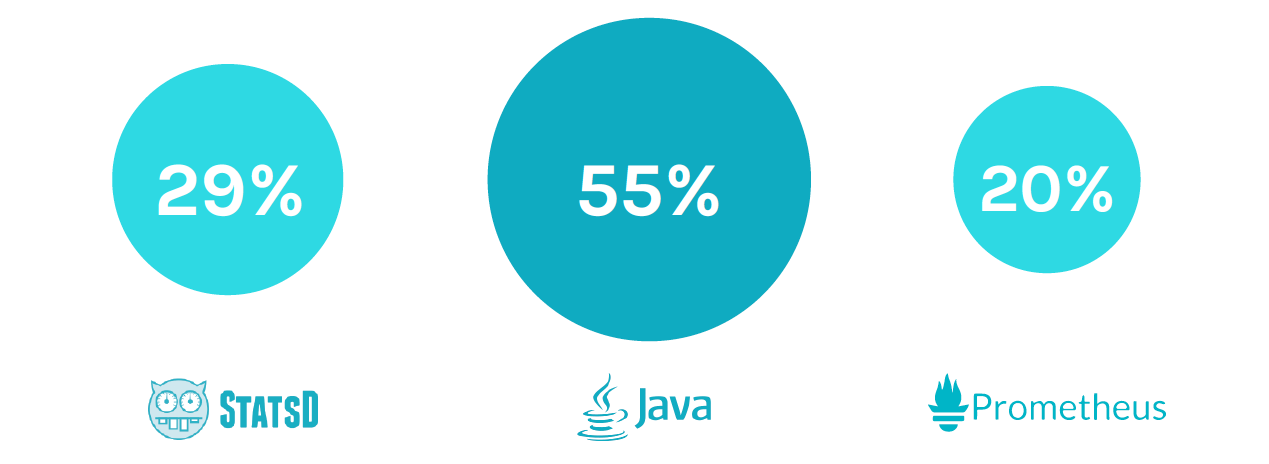
Figure 13. JMX is the most used custom metric format.
Sysdig’s unique instrumentation model automatically collects, without manual configuration, custom metrics like
JMX,
StatsD, and
Prometheus. This gives us insight into the metrics Developers rely on to monitor various aspects of their applications – like request time and heap usage. We asked the question – “Of customers running containers in their environments, what percentage are using custom metrics, and which ones?”
JMX metrics associated with Java applications were used by 55% of Sysdig SaaS users. This aligns with the fact that we see Java apps are very widely deployed. StatsD comes in at 29% and Prometheus is used by 20% of our SaaS users. With the
popularity of Prometheus and its avid community support, we expect this number to grow over time.
Popular container registries
Key assessment: It’s a split decision. Registries are critical but there’s no clear leader
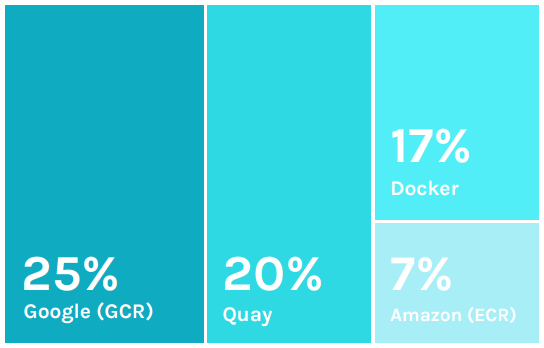
This year we again identified registries-in-use. Of the top 3,
Google Container Registry (GCR) has the largest percentage,
Quay is the second most used, followed by Docker and Amazon
Elastic Container Registry (ECR). GCR and ACR are both fully-managed cloud-based private Docker container registries. Quay and Docker can be used either as on-premises solutions or run in the cloud. One caveat for these numbers – only a subset of the user base, just over 50% provided a clear indication of their registry solution.
Summary: Momentum and maturity continue with the new stack
The data in this year’s report provides a point of visibility into the momentum behind the solutions that help customers as they build microservices-based services using containers and modern DevOps practices. New approaches are maturing and helping organizations develop applications more quickly to solve real business challenges and compete in the digital marketplace. We’ll be back next year to share what’s changed in the fast moving Docker space.
Would you like a downloadable PDF version of this report?
Grab it here. Also, check out our
recent cloud native and security reports.