
The control plane is the brain and heart of Kubernetes. All of its components are key to the proper working and efficiency of the cluster. Monitor Kubernetes control plane is just as important as monitoring the status of the nodes or the applications running inside. It may be even more important, because an issue with the control plane will affect all of the applications and cause potential outages.
Kubernetes control plane explained
The main components of the control plane are:
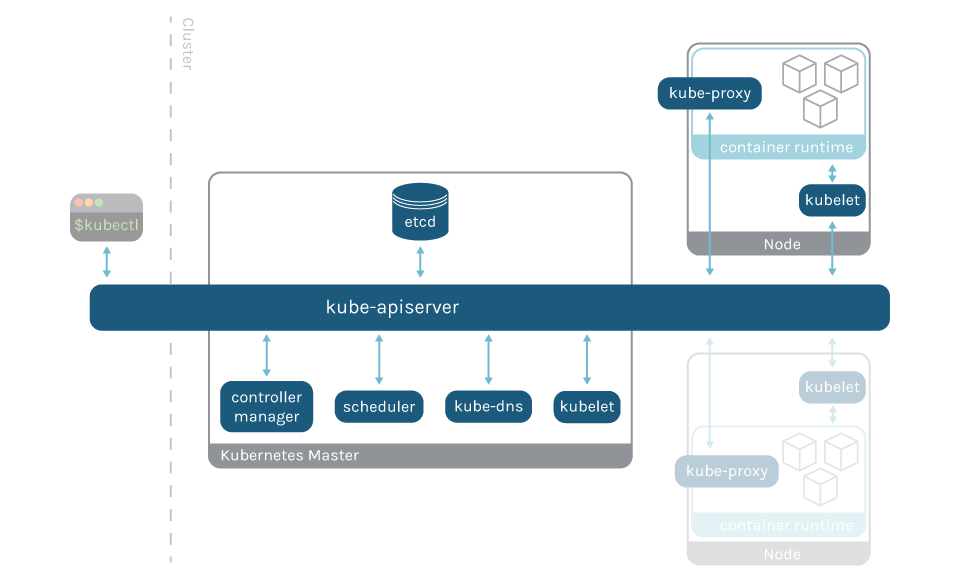
APIserver
All of the services running inside the cluster use this interface to communicate between each other. The entirety of user interaction is handled through the API server as well, since kubectl is a wrapper to send requests to the API.
Kubelet
Kubelet is the component that checks that the containers described by Pods are running in the nodes. Kubelet works in a declarative way by receiving PodSpecs and ensuring that the current state matches desired pods.
etcd
It stores your cluster desired state (e.g., pods, secrets, deployments, etc.), among other things. If this service isn’t running, you won’t be able to deploy anything and the cluster can’t self-heal.
Controller manager
Kube-controller-manager runs in master nodes and takes care of the different controller processes. These controllers watch the status of the different services deployed through the API and take corrective actions in case real and desired status don’t match.
Kube-proxy
Kube-proxy is an implementation of a network proxy and a load balancer, and is the link of each node with the api-server. It runs in each node of your cluster, and allows you to connect each pod from inside or outside of the cluster.
kube-dns
This service receives all of the name resolution requests in the cluster, and makes available the internal names for all the applications and services.
How to monitor Kubernetes control plane components
We have analyzed in several articles the different components in the control plane.
In them, you can find instructions to configure these services to offer Prometheus metrics. Additionally, they explain what values will help you detect issues, and contain some example PromQL alerts:
- How to monitor Kubernetes apiserver
- How to monitor kubelet
- How to monitor etcd
- How to monitor controller-manager
- How to monitor kube-proxy
- How to monitor core-dns
Conclusion
Monitoring Kubernetes control plane is essential to maintain your clusters in good condition. Detecting issues in the control plane will speed up your incident response, and will reduce outages in the applications running in the cluster.
Visit PromCat.io to find resources to easily monitor the Kubernetes control plane, including dashboard and alert templates that are ready to import into Sysdig Monitor and other monitoring tools.
You can also check out our Kubernetes Monitoring Guide. This comprehensive PDF guide is packed with explanations, best practices, and examples that you can use for reference.