
Learning how to monitor the Kubernetes API server is crucial when running cloud-native applications in Kubernetes environments.
The Kubernetes API server can be considered as the front end of the Kubernetes control plane. Any interaction or request from users or internal Kubernetes components with the control plane go through this component. Ensuring you monitor the Kubernetes API server properly is of vital importance to ensure your Kubernetes cluster works as expected.
Anticipate any problem in the Kubernetes API server by monitoring errors, as well as measuring latencies, requests, and saturation.
Would you like to learn more about monitoring the API server? Do you want to know what the key kube-apiserver metrics are?
You are in the right place. keep reading! 🔍
This article will cover the following topics:
- What is the Kubernetes API server?
- How to monitor Kubernetes API server
- Monitoring API server: Which metrics should you check?
- Conclusion
What is the Kubernetes API server?
The Kubernetes API server is a key component of a Kubernetes cluster. It can actually be considered as the core of the control plane. It provides a front end service, via exposing an HTTP API interface, allowing end users, other internal components of Kubernetes, and external components to establish communication. The Kubernetes API interface provides a way to query and request information on Kubernetes objects, and at the same time, it is the gateway to be used when modifying the state of API objects in Kubernetes, like Pods, Deployments, ConfigMaps, Secrets, Namespaces, etc.
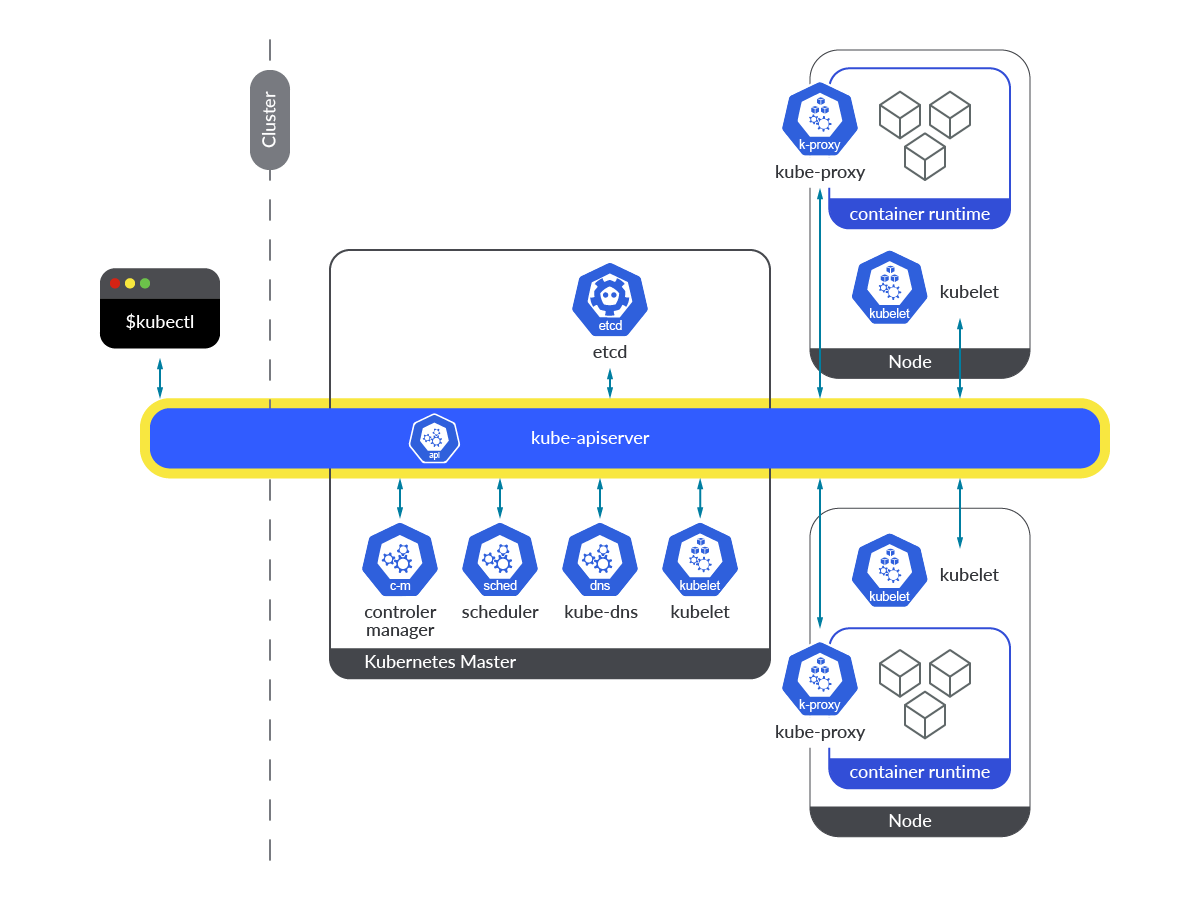
Kubernetes API server runs as a container (kube-apiserver) within Pods in the kube-system namespace. In order to make its access easier, it’s exposed through a service named kubernetes in the default namespace. Pods accessing the Kubernetes API server service (kubernetes.default.svc) are allowed to access by using a ServiceAccount token mounted in the Pod itself, through the secure HTTP port 443.
$ kubectl get pods -n kube-system |grep apiserver
kube-apiserver-k8s-control-1.lab.example.com            1/1     Running   6   54d
kube-apiserver-k8s-control-2.lab.example.com            1/1     Running   6   50d
kube-apiserver-k8s-control-3.lab.example.com            1/1     Running   6   50d

$ kubectl get svc kubernetes -n default
NAME         TYPE        CLUSTER-IP   EXTERNAL-IP   PORT(S)   AGE
kubernetes   ClusterIP   10.96.0.1    <none>        443/TCP   54dCode language: JavaScript (javascript)
Any of the Kubernetes API server endpoints are accessible from each of the Kubernetes nodes or from any of the Pods running on those nodes in the cluster. In any case, the API request must be done through the default kube-apiserver endpoint port, which is 6443. If an end user tries to connect to any of these endpoints directly, it will need to possess both client certificate and key for authentication purposes, plus the CA certificate for relying on the Certificate Authority that signed the Kubernetes certificate.
$ kubectl get ep kubernetes -n default
NAME         ENDPOINTS                                                     AGE
kubernetes   192.168.119.30:6443,192.168.119.31:6443,192.168.119.32:6443   54dCode language: JavaScript (javascript)
Let’s see how to curl the Kubernetes API server from a random application Pod.
$ kubectl exec -it ratings-v1-85c74b6cb4-72tkm -n default -- /bin/bash
node@ratings-v1-85c74b6cb4-72tkm:/opt/microservices$ curl --cacert /var/run/secrets/kubernetes.io/serviceaccount/ca.crt -H "Authorization: Bearer $(cat /var/run/secrets/kubernetes.io/serviceaccount/token)" https://kuberntes.default.svc/api
{
  "kind": "APIVersions",
  "versions": [
    "v1"
  ],
  "serverAddressByClientCIDRs": [
    {
      "clientCIDR": "0.0.0.0/0",
      "serverAddress": "192.168.119.30:6443"
    }
  ]Code language: JavaScript (javascript)
Another way to access the Kubernetes API server is using the kubectl CLI tool, which communicates underneath with the API, using the certificates embedded in the kubeconfig file. Every time a Kubernetes user does a kubectl get pods (or any other object), or edits any object via kubectl edit … , what is really happening is the CLI communicating with the Kubernetes API server.

How to monitor Kubernetes API server
As mentioned earlier, the API server is already instrumented to provide a metrics endpoint to monitor the Kubernetes API server. You can scrape this endpoint very easily, without the need of any additional exporter. Just get access either through the kubernetes service HTTPs port (443), or any of the endpoints HTTPs port (6443).
Let’s see how you can get access to the metrics. 🔧
Getting access to the endpoint manually
Use curl or wget to reach the kubernetes service from a Pod, either on the host network or on the default IP SDN range. You’ll need the CA (ca.crt) file for relying on the Certificate Authority that signed the Kubernetes certificate, and the token for authentication purposes. The ServiceAccount assigned to your Pod must have enough permissions to access the metrics endpoint.
$ kubectl get clusterrolebinding prometheus-server -n monitoring -o json|jq ".roleRef,.subjects"
{
  "apiGroup": "rbac.authorization.k8s.io",
  "kind": "ClusterRole",
  "name": "prometheus-server"
}
[
  {
    "kind": "ServiceAccount",
    "name": "prometheus-server",
    "namespace": "monitoring"
  }
]

$ kubectl get clusterrole prometheus-server -o json |jq ".rules[2]"
{
  "nonResourceURLs": [
    "/metrics"
  ],
  "verbs": [
    "get"
  ]
}Code language: JavaScript (javascript)
$ curl --cacert /var/run/secrets/kubernetes.io/serviceaccount/ca.crt -H "Authorization: Bearer $(cat /var/run/secrets/kubernetes.io/serviceaccount/token)" https://kubernetes.default.svc/metrics
# HELP aggregator_openapi_v2_regeneration_count [ALPHA] Counter of OpenAPI v2 spec regeneration count broken down by causing APIService name and reason.
# TYPE aggregator_openapi_v2_regeneration_count counter
aggregator_openapi_v2_regeneration_count{apiservice="*",reason="startup"} 0
aggregator_openapi_v2_regeneration_count{apiservice="k8s_internal_local_delegation_chain_0000000002",reason="update"} 0
aggregator_openapi_v2_regeneration_count{apiservice="v3.projectcalico.org",reason="add"} 0
aggregator_openapi_v2_regeneration_count{apiservice="v3.projectcalico.org",reason="update"} 0
# HELP aggregator_openapi_v2_regeneration_duration [ALPHA] Gauge of OpenAPI v2 spec regeneration duration in seconds.
# TYPE aggregator_openapi_v2_regeneration_duration gauge
aggregator_openapi_v2_regeneration_duration{reason="add"} 0.083819032
aggregator_openapi_v2_regeneration_duration{reason="startup"} 0.02308697
(output truncated)Code language: PHP (php)Well done! You already have the kube-apiserver metrics handy!
Let’s go with the most interesting part,seeing how you can scrape these Kubernetes API server metrics from Prometheus.
How to configure Prometheus to scrape Kubernetes API server metrics
In this section, you’ll learn how to enable your Prometheus instance to scrape metrics from the Kubernetes API server metrics endpoints. If you have deployed Prometheus using the community Prometheus Helm chart, you’ll realize this and other configs are already enabled by default.
Following, you’ll find the Prometheus job. You only need edit your Prometheus ConfigMap and add it under the scrape_configs section.
$ kubectl get cm prometheus-server -n monitoring -o yaml > prometheus-server.yaml
$ vi prometheus-server.yaml
scrape_configs:
…
    - bearer_token_file: /var/run/secrets/kubernetes.io/serviceaccount/token
      job_name: kubernetes-apiservers
      kubernetes_sd_configs:
      - role: endpoints
      relabel_configs:
      - action: keep
        regex: default;kubernetes;https
        source_labels:
        - __meta_kubernetes_namespace
        - __meta_kubernetes_service_name
        - __meta_kubernetes_endpoint_port_name
      scheme: https
      tls_config:
        ca_file: /var/run/secrets/kubernetes.io/serviceaccount/ca.crtCode language: PHP (php)
Similarly, the ClusterRole you need for scraping the Kubernetes API server metrics endpoint is provided out of the box when deploying Prometheus using the community Prometheus Helm chart. Otherwise, ensure your ServiceAccount is already bound to a ClusterRole with enough permissions.
rules:
- nonResourceURLs:
  - /metrics
  verbs:
  - get
Then apply the new configuration and recreate the Prometheus-server Pod.
$ kubectl replace -f prometheus-server.yaml -n monitoring
$ kubectl delete pod prometheus-server-5df7b6d9bb-m2d27 -n monitoringCode language: JavaScript (javascript)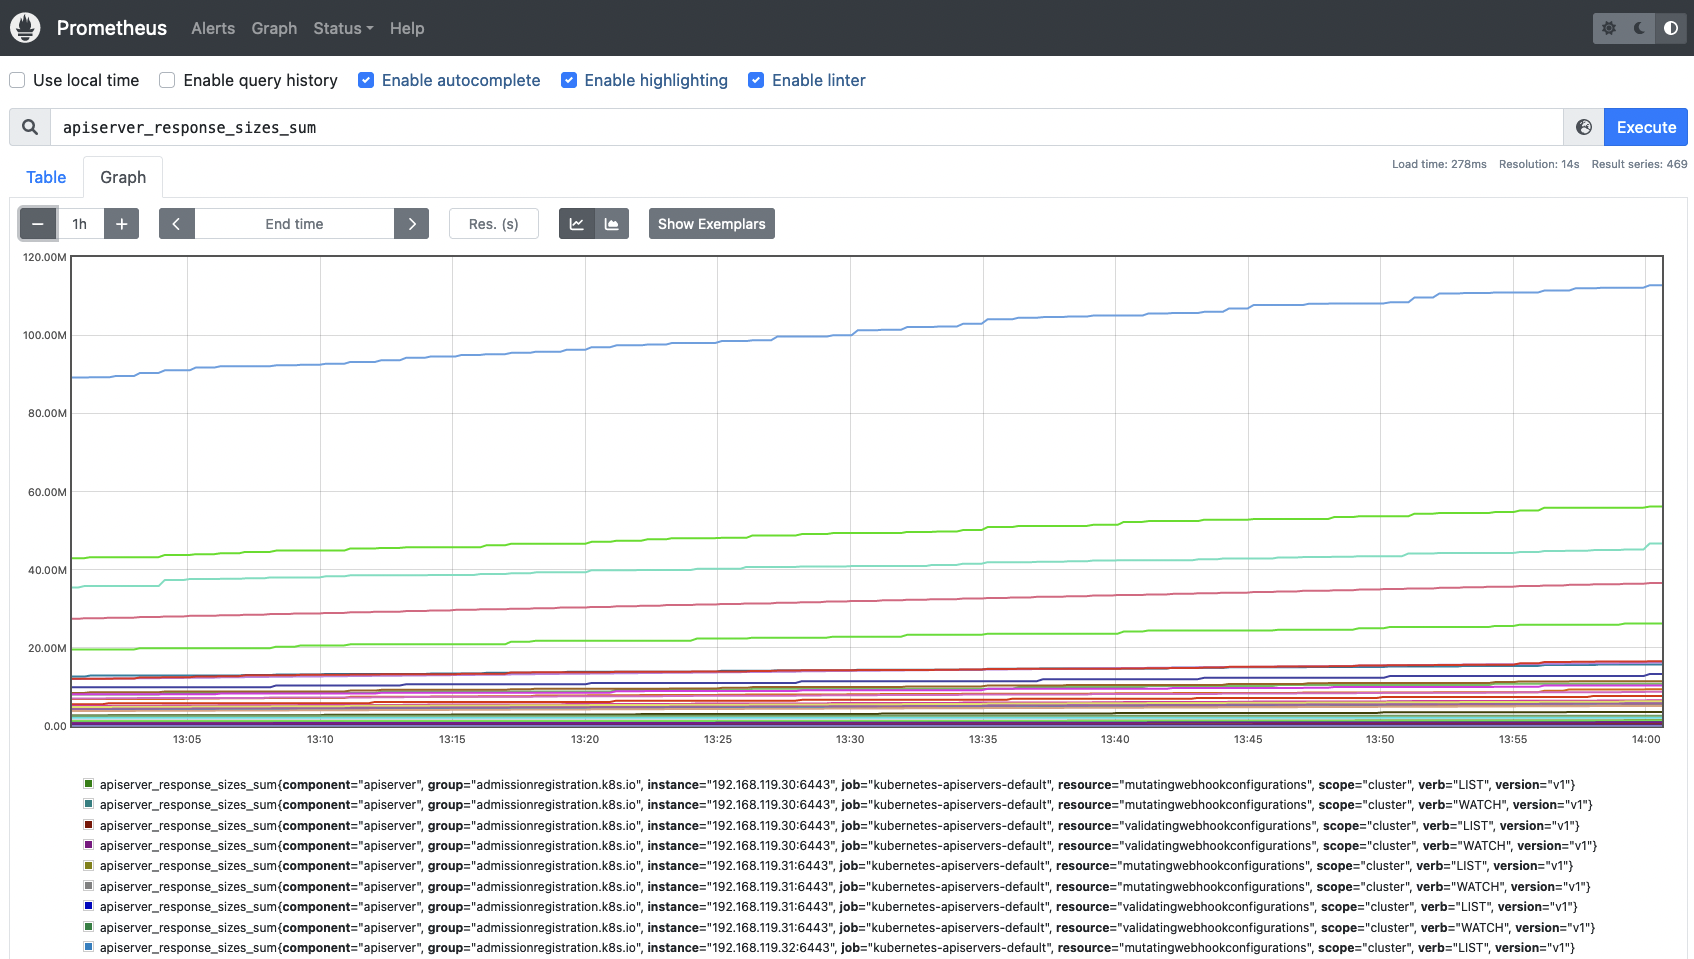
Once the new job is added to the ConfigMap, recreate the Prometheus Pod and wait until it starts again. Go to the Prometheus web UI and look for any of the Kubernetes API server metrics.
Monitoring API server: Which metrics should you check?
You already know how to monitor the Kubernetes API server, but there is one question that has not been answered yet: Which metrics should you check?
Grab a pen and paper if you are interested in the key Kubernetes API server metrics! 📝
Let’s split this into four different categories: the four golden signals to monitor the Kubernetes API server.
Disclaimer: API server metrics might differ between Kubernetes versions and platforms. Here, we used Kubernetes 1.25. You can check the metrics available for your version in the Kubernetes repo (link for the 1.25 version).
Latency
Latency can be considered as the time it takes to serve a request. You may want to monitor latencies on the API server requests. This way you’ll get a better understanding of how your API server is responding. High latencies, or latency growth over time, might indicate performance or availability issues in some of the API server components. The following metric used to measure latencies can be segmented by verb. That way, in the event of facing issues, you can easily identify if it is a problem reading information (GET) or writing (POST), among other things.
apiserver_request_duration_seconds_bucket: This metric measures the latency for each request to the Kubernetes API server in seconds. Data is broken down into different categories, like verb, group, version, resource, component, etc. You may want to use ahistogram_quantileto see how latency is distributed among verbs.histogram_quantile(0.99, sum(rate(apiserver_request_duration_seconds_bucket{job="kubernetes-apiservers"}[5m])) by (verb, le))# HELP apiserver_request_duration_seconds [STABLE] Response latency distribution in seconds for each verb, dry run value, group, version, resource, subresource, scope and component. # TYPE apiserver_request_duration_seconds histogram apiserver_request_duration_seconds_bucket{component="",dry_run="",group="",resource="",scope="",subresource="/healthz",verb="GET",version="",le="0.005"} 7624 apiserver_request_duration_seconds_bucket{component="",dry_run="",group="",resource="",scope="",subresource="/healthz",verb="GET",version="",le="0.025"} 7977 apiserver_request_duration_seconds_bucket{component="",dry_run="",group="",resource="",scope="",subresource="/healthz",verb="GET",version="",le="0.05"} 7978 apiserver_request_duration_seconds_bucket{component="",dry_run="",group="",resource="",scope="",subresource="/healthz",verb="GET",version="",le="0.1"} 7980 apiserver_request_duration_seconds_bucket{component="",dry_run="",group="",resource="",scope="",subresource="/healthz",verb="GET",version="",le="0.2"} 7981 apiserver_request_duration_seconds_bucket{component="",dry_run="",group="",resource="",scope="",subresource="/healthz",verb="GET",version="",le="0.4"} 7981 apiserver_request_duration_seconds_bucket{component="",dry_run="",group="",resource="",scope="",subresource="/healthz",verb="GET",version="",le="0.6"} 7981 apiserver_request_duration_seconds_bucket{component="",dry_run="",group="",resource="",scope="",subresource="/healthz",verb="GET",version="",le="0.8"} 7981 apiserver_request_duration_seconds_bucket{component="",dry_run="",group="",resource="",scope="",subresource="/healthz",verb="GET",version="",le="1"} 7981 apiserver_request_duration_seconds_bucket{component="",dry_run="",group="",resource="",scope="",subresource="/healthz",verb="GET",version="",le="1.25"} 7981 apiserver_request_duration_seconds_bucket{component="",dry_run="",group="",resource="",scope="",subresource="/healthz",verb="GET",version="",le="1.5"} 7981 apiserver_request_duration_seconds_bucket{component="",dry_run="",group="",resource="",scope="",subresource="/healthz",verb="GET",version="",le="2"} 7981 apiserver_request_duration_seconds_bucket{component="",dry_run="",group="",resource="",scope="",subresource="/healthz",verb="GET",version="",le="3"} 7981 apiserver_request_duration_seconds_bucket{component="",dry_run="",group="",resource="",scope="",subresource="/healthz",verb="GET",version="",le="4"} 7981 apiserver_request_duration_seconds_bucket{component="",dry_run="",group="",resource="",scope="",subresource="/healthz",verb="GET",version="",le="5"} 7981 apiserver_request_duration_seconds_bucket{component="",dry_run="",group="",resource="",scope="",subresource="/healthz",verb="GET",version="",le="6"} 7981 apiserver_request_duration_seconds_bucket{component="",dry_run="",group="",resource="",scope="",subresource="/healthz",verb="GET",version="",le="8"} 7981 apiserver_request_duration_seconds_bucket{component="",dry_run="",group="",resource="",scope="",subresource="/healthz",verb="GET",version="",le="10"} 7981 apiserver_request_duration_seconds_bucket{component="",dry_run="",group="",resource="",scope="",subresource="/healthz",verb="GET",version="",le="15"} 7981 apiserver_request_duration_seconds_bucket{component="",dry_run="",group="",resource="",scope="",subresource="/healthz",verb="GET",version="",le="20"} 7981 apiserver_request_duration_seconds_bucket{component="",dry_run="",group="",resource="",scope="",subresource="/healthz",verb="GET",version="",le="30"} 7981 apiserver_request_duration_seconds_bucket{component="",dry_run="",group="",resource="",scope="",subresource="/healthz",verb="GET",version="",le="45"} 7981 apiserver_request_duration_seconds_bucket{component="",dry_run="",group="",resource="",scope="",subresource="/healthz",verb="GET",version="",le="60"} 7981 apiserver_request_duration_seconds_bucket{component="",dry_run="",group="",resource="",scope="",subresource="/healthz",verb="GET",version="",le="+Inf"} 7981 (output truncated)
Traffic
The total amount of traffic handled by the API server. You may want check the total amount of requests by resource (apiservices, daemonsets, pods, namespaces, deployments, etc.), monitor how much traffic is being processed by verb (GET, POST, LIST, WATCH, etc.), or even the HTTP codes for every request or group of requests. You can evaluate whether your traffic volume is good or bad by measuring and comparing the 2xx HTTP requests vs the 4xx and 5xx HTTP requests. Saturation metrics can help identify and correlate traffic issues as well.
apiserver_request_total: This metric can be used to count the number of requests to the Kubernetes API server, where they are coming from, to which component it’s accessing, and whether it was successful or not. You can easily measure the successful rate of requests across the Kubernetes API service (check for 2xx HTTP response codes):sum(rate(apiserver_request_total{job="kubernetes-apiservers",code=~"2.."}[5m]))# HELP apiserver_request_total [STABLE] Counter of apiserver requests broken out for each verb, dry run value, group, version, resource, scope, component, and HTTP response code. # TYPE apiserver_request_total counter apiserver_request_total{code="0",component="apiserver",dry_run="",group="",resource="pods",scope="resource",subresource="exec",verb="POST",version="v1"} 3 apiserver_request_total{code="200",component="",dry_run="",group="",resource="",scope="",subresource="/healthz",verb="GET",version=""} 7981 apiserver_request_total{code="200",component="",dry_run="",group="",resource="",scope="",subresource="/livez",verb="GET",version=""} 1602 apiserver_request_total{code="200",component="",dry_run="",group="",resource="",scope="",subresource="/readyz",verb="GET",version=""} 16006 apiserver_request_total{code="200",component="apiserver",dry_run="",group="",resource="configmaps",scope="cluster",subresource="",verb="LIST",version="v1"} 1 apiserver_request_total{code="200",component="apiserver",dry_run="",group="",resource="configmaps",scope="cluster",subresource="",verb="WATCH",version="v1"} 36 apiserver_request_total{code="200",component="apiserver",dry_run="",group="",resource="configmaps",scope="namespace",subresource="",verb="LIST",version="v1"} 89 apiserver_request_total{code="200",component="apiserver",dry_run="",group="",resource="configmaps",scope="namespace",subresource="",verb="WATCH",version="v1"} 1775 apiserver_request_total{code="200",component="apiserver",dry_run="",group="",resource="configmaps",scope="resource",subresource="",verb="GET",version="v1"} 7850 apiserver_request_total{code="200",component="apiserver",dry_run="",group="",resource="configmaps",scope="resource",subresource="",verb="PUT",version="v1"} 8704 apiserver_request_total{code="200",component="apiserver",dry_run="",group="",resource="endpoints",scope="cluster",subresource="",verb="LIST",version="v1"} 1 apiserver_request_total{code="200",component="apiserver",dry_run="",group="",resource="endpoints",scope="cluster",subresource="",verb="WATCH",version="v1"} 33 apiserver_request_total{code="200",component="apiserver",dry_run="",group="",resource="endpoints",scope="namespace",subresource="",verb="LIST",version="v1"} 1 apiserver_request_total{code="200",component="apiserver",dry_run="",group="",resource="endpoints",scope="resource",subresource="",verb="GET",version="v1"} 2121 apiserver_request_total{code="200",component="apiserver",dry_run="",group="",resource="endpoints",scope="resource",subresource="",verb="PUT",version="v1"} 1 apiserver_request_total{code="200",component="apiserver",dry_run="",group="",resource="events",scope="resource",subresource="",verb="PATCH",version="v1"} 570 (output truncated)
Errors
The same way you monitor the traffic, you can check the error rates and volume of errors your API server is processing. This is an easy way to identify issues at the API server level, or even on other components of the control plane.
apiserver_request_total: You can use the same metric to measure errors, this time looking for 4xx and 5xx HTTP response codes.sum(rate(apiserver_request_total{job="kubernetes-apiservers",code=~"[45].."}[5m]))
It is even more interesting monitoring the error rate vs the total amount of requests, this way you get the magnitude of the errors for the Kubernetes API server requests.
sum(rate(apiserver_request_total{job="kubernetes-apiservers",code=~"[45].."}[5m]))*100/sum(rate(apiserver_request_total{job="kubernetes-apiservers"}[5m]))Code language: JavaScript (javascript)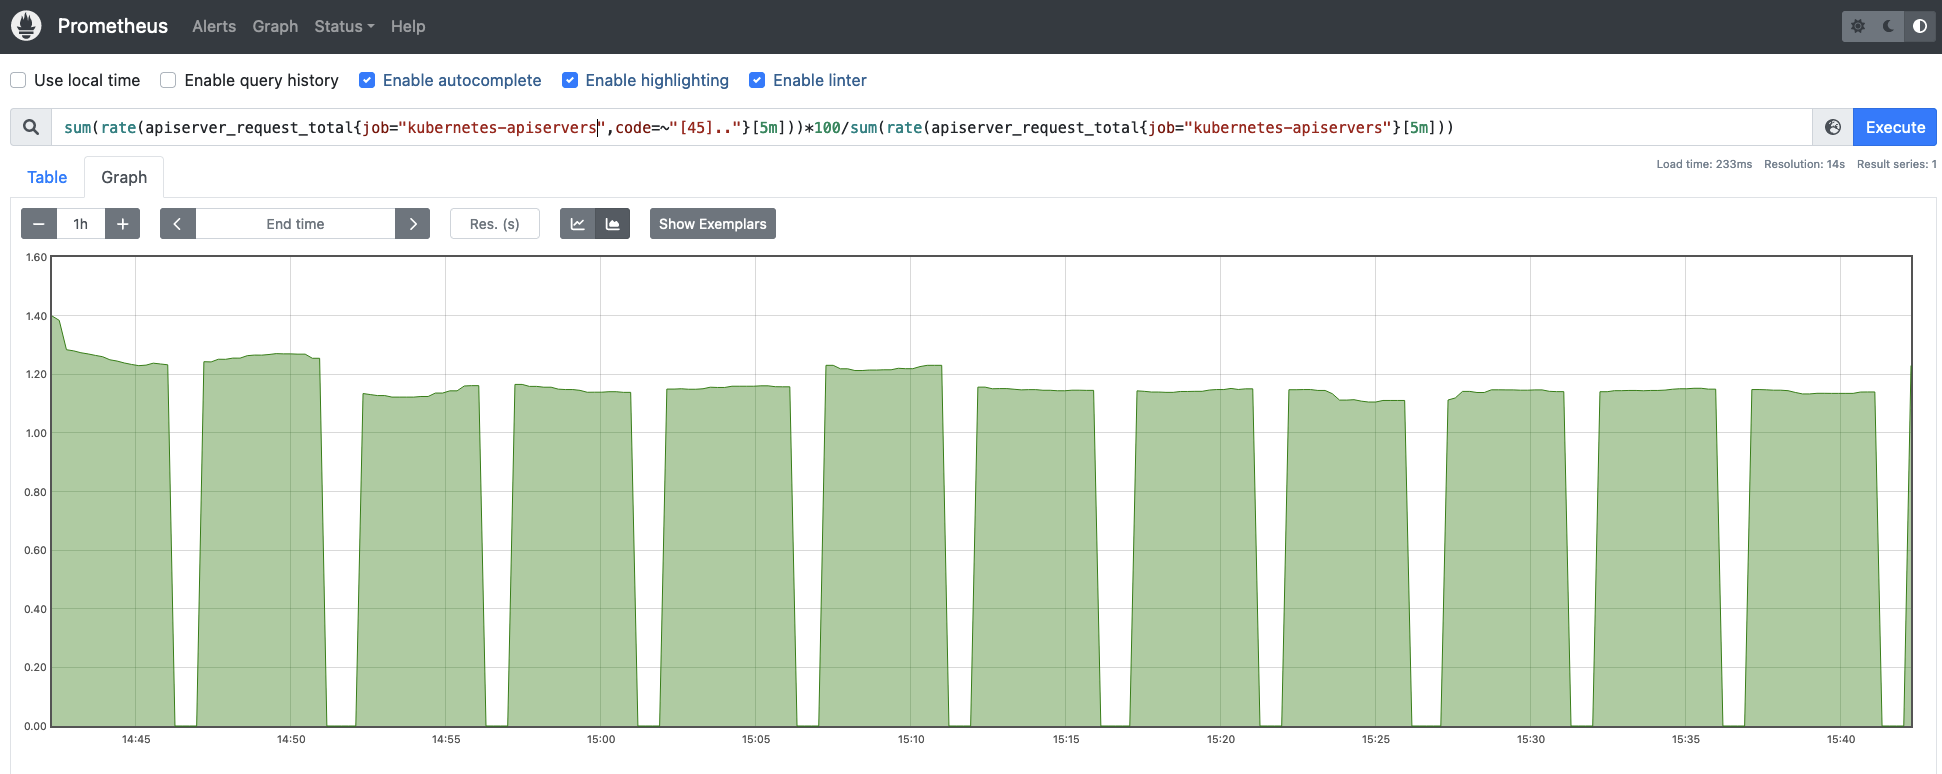
Saturation
You can easily monitor Kubernetes API saturation using the system resource consumption metrics, like CPU, memory, and network usage for Kubernetes API server.
There are some other metrics that will give you a better understanding of how the Kubernetes API server is performing.
workqueue_adds_total: This metric measures the number of additions handled by the workqueue.rate(workqueue_adds_total{job="kubernetes-apiservers"}[5m])# HELP workqueue_adds_total [ALPHA] Total number of adds handled by workqueue # TYPE workqueue_adds_total counter workqueue_adds_total{name="APIServiceRegistrationController"} 1733 workqueue_adds_total{name="AvailableConditionController"} 17171 workqueue_adds_total{name="DiscoveryController"} 2150 workqueue_adds_total{name="DynamicCABundle-aggregator-proxy-cert"} 1 workqueue_adds_total{name="DynamicCABundle-client-ca-bundle"} 3 workqueue_adds_total{name="DynamicCABundle-request-header"} 3 workqueue_adds_total{name="DynamicCABundle-serving-cert"} 1 workqueue_adds_total{name="DynamicServingCertificateController"} 267 workqueue_adds_total{name="admission_quota_controller"} 925 workqueue_adds_total{name="autoregister"} 3896 workqueue_adds_total{name="cluster_authentication_trust_controller"} 267 workqueue_adds_total{name="crdEstablishing"} 0 workqueue_adds_total{name="crd_autoregistration_controller"} 2220 workqueue_adds_total{name="crd_finalizer"} 0 workqueue_adds_total{name="crd_naming_condition_controller"} 1944 workqueue_adds_total{name="crd_openapi_controller"} 1944 workqueue_adds_total{name="crd_openapi_v3_controller"} 1944 workqueue_adds_total{name="kubernetes_api_approval_conformant_condition_controller"} 1944 workqueue_adds_total{name="non_structural_schema_condition_controller"} 1944 workqueue_adds_total{name="open_api_aggregation_controller"} 32142 workqueue_adds_total{name="open_api_v3_aggregation_controller"} 48322 workqueue_adds_total{name="priority_and_fairness_config_queue"} 1
workqueue_depth: This time, it measures how big the workqueue is. How many actions in the workqueue are waiting to be processed?# HELP workqueue_depth [ALPHA] Current depth of workqueue # TYPE workqueue_depth gauge workqueue_depth{name="APIServiceRegistrationController"} 0 workqueue_depth{name="AvailableConditionController"} 0 workqueue_depth{name="DiscoveryController"} 0 workqueue_depth{name="DynamicCABundle-aggregator-proxy-cert"} 0 workqueue_depth{name="DynamicCABundle-client-ca-bundle"} 0 workqueue_depth{name="DynamicCABundle-request-header"} 0 workqueue_depth{name="DynamicCABundle-serving-cert"} 0 workqueue_depth{name="DynamicServingCertificateController"} 0 workqueue_depth{name="admission_quota_controller"} 0 workqueue_depth{name="autoregister"} 0 workqueue_depth{name="cluster_authentication_trust_controller"} 0 workqueue_depth{name="crdEstablishing"} 0 workqueue_depth{name="crd_autoregistration_controller"} 0 workqueue_depth{name="crd_finalizer"} 0 workqueue_depth{name="crd_naming_condition_controller"} 0 workqueue_depth{name="crd_openapi_controller"} 0 workqueue_depth{name="crd_openapi_v3_controller"} 0 workqueue_depth{name="kubernetes_api_approval_conformant_condition_controller"} 0 workqueue_depth{name="non_structural_schema_condition_controller"} 0 workqueue_depth{name="open_api_aggregation_controller"} 0 workqueue_depth{name="open_api_v3_aggregation_controller"} 0 workqueue_depth{name="priority_and_fairness_config_queue"} 0
Conclusion
The Kubernetes API server is the core of the control plane. Queries, requests for information about the Kubernetes objects, and changes on the status of these objects are processed through this component.
Monitoring the Kubernetes API server is of vital importance if you want to ensure your Kubernetes cluster’s stability and performance. Failing in such a task may cause a lot of difficulties for your workloads and services, like not being able to stop, update, or start new Pods, Services, ReplicationController, and more.
In this article, you have learned how to monitor the Kubernetes API server, and how to use a Prometheus instance to scrape the metrics endpoint. In addition, you have learned more about the key kube-apiserver metrics, so you have all the tools you may need to be successful with monitoring the API server.
Monitor Kubernetes and troubleshoot issues up to 10x faster
Sysdig can help you monitor and troubleshoot your Kubernetes cluster with the out-of-the-box dashboards included in Sysdig Monitor. Advisor, a tool integrated in Sysdig Monitor accelerates troubleshooting of your Kubernetes clusters and its workloads by up to 10x.
Sign up for a 30-day trial account and try it yourself!